The statistics for a property is recorded by activity on the sales site. Your sales site sends the activity to the datawarehouse where it is aggregated and prepared for the dashboard.
Typically, your dashboard has three primary numbers on the main screen. let’s go through them now.

Impressions
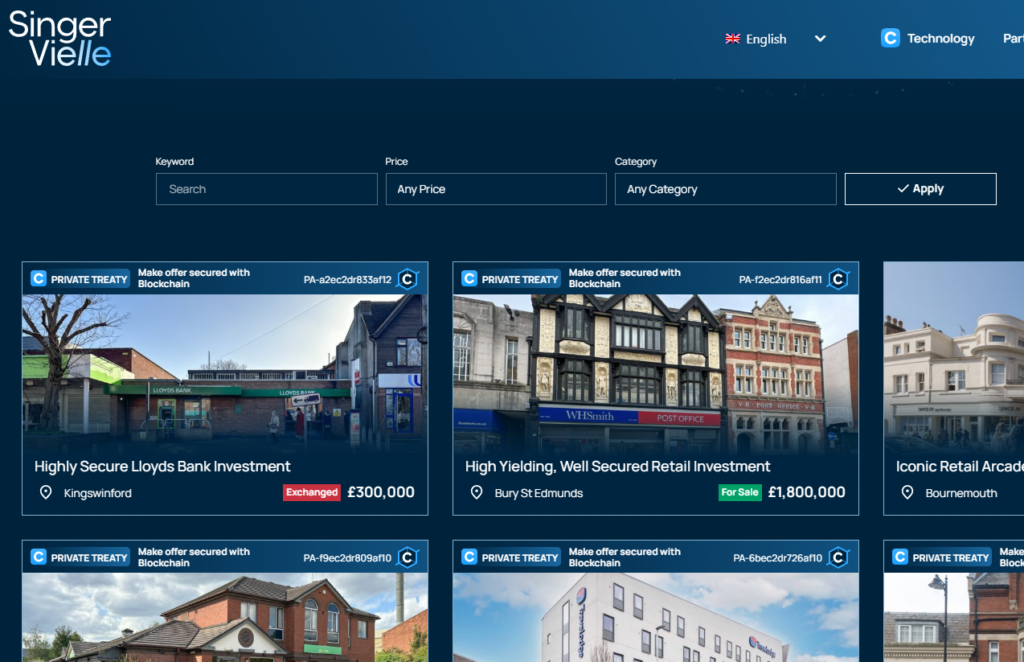
The first number is incremented when a property card is rendered on any URL of the sales site. A card can appear on the homepage, properties page (after filtering/searching), or on a case study.

When the homepage is rendered, each property card gets a +1 bump on its impression count.
Fun fact: The word impression comes from imprint, impression of an glyph into something. We use this word for printing as letters where impressioned. Later this was adopted by newspapers and then online, to mean how many times the thing was ‘impressioned’ or stamped. With the web, it is used to show "renders" or how many times it was shown. This is distinct from ‘views’.
Views
When you click on a card or go directly to the full information for a property, we record this as a view.

A view count gets a +1 view when you land on the property details page, and only when you land on this page.
NOTE: The impression count does not increase when you land on this page.
Downloads
When you download a brochure (some browsers may open it in the tab, instead), we count this as a +1 for downloads.

What are the little numbers below?
On the statistics display, we also show what the count was for impressions, views and downloads over the current 24 hours.
From midnight, the number starts increasing and throughout the day. Perhaps you sent an email campaign or other marketing push and you will be able to see this number increase throughout the day.

We show these numbers in green.
When do these numbers update?
As you can imagine, we have to process a lot of data. Every sales website can get hundreds of views and dozens on different properties. When the data is aggregated we take care to ensure data is sent to the correct property, location, timestamp and we count these numbers, aggregating them for the client dashboard. This process runs approximately every 20 minutes, however it can only process a certain number of statistics in those twenty minutes. Imagine we have to aggregate 10 000 statistics and process 2000 every 20 minutes and imagine the stats you are concerned with as sitting at the end of the 10 000 (in terms of date order). It would take 5 x 20 minutes to run the data.
NOTE: The numbers provided here is just a guide. We are actually tweaking things all the time to ensure we process more and more data quicker.
See guide to accessing your property analytics.

